Overview:
- Andrews curves project multivariate data, through the vector formed by the co-efficients of the finite Fourier series on to a two-dimensional space.
- The Fourier series and the vector is given by
- x(t) = x1/√2 +x2sin(t) +x3cos(t) +x4sin(2t) +x5cos(2t)
- 1/√2,sin(t),cos(t),sin(2t),cos(2t), . .
- Each data point "t" in the multivariate data, is represented by a curve between −π and π.
- If two curves appear closer in the Andrews Curves plot, then these two data points are indeed closer.
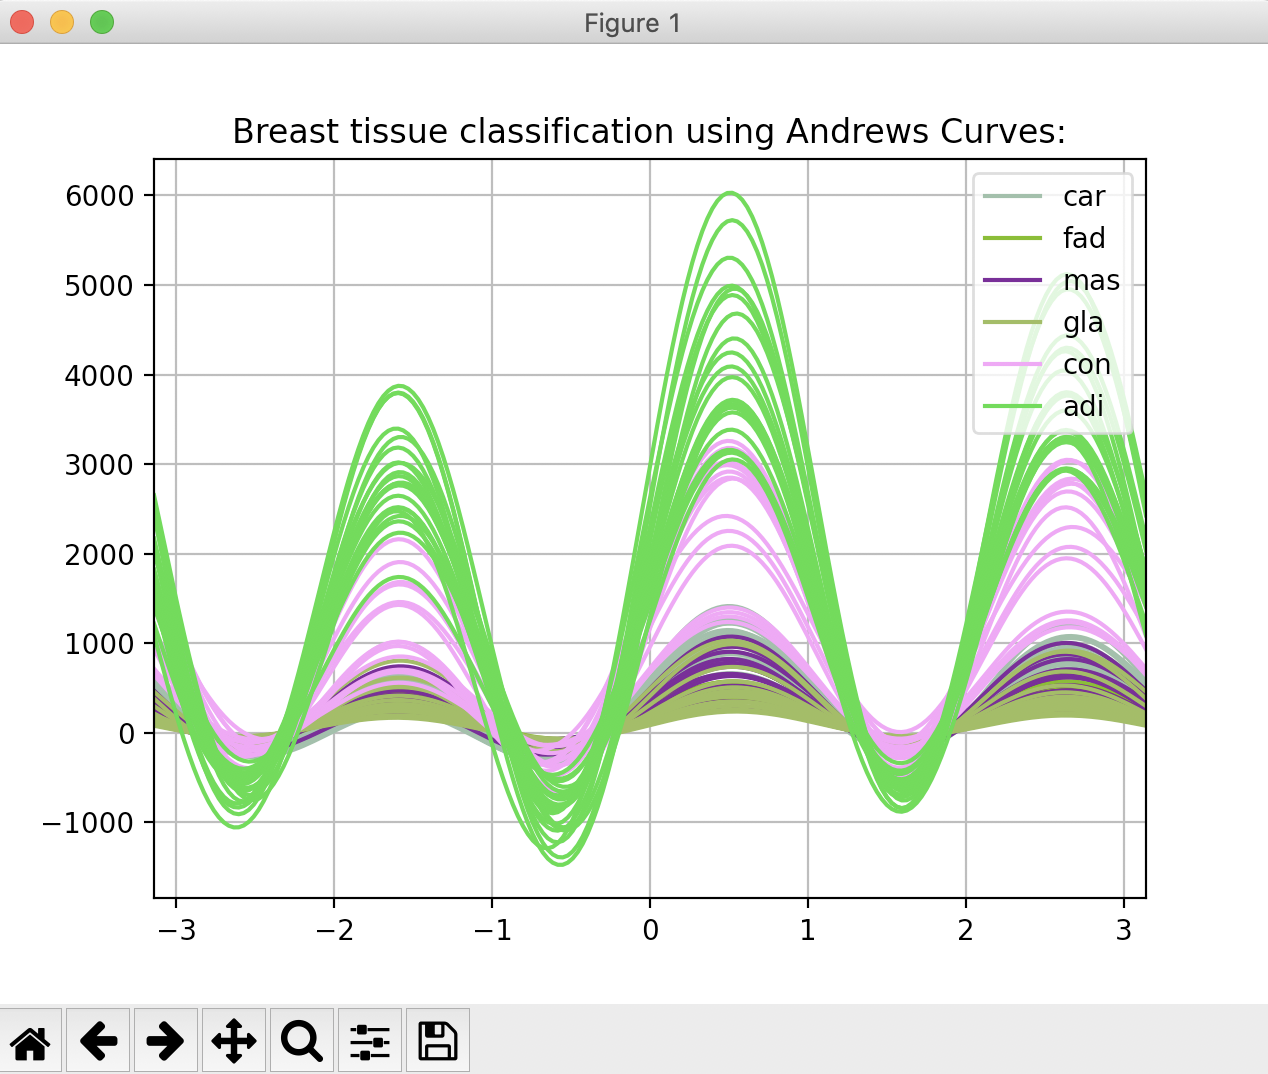
- Given a "class" column of a pandas DataFrame, the function andrews_curves() from the plotting module of the pandas library, draws Andrews curves.
Example 1:
|
# Example Python program that plots import pandas as pds # Read data from a CSV file into a DataFrame # Draw Andrews curves plt.title("Breast tissue classification using Andrews Curves:"); |
Output: